
There is a comfortable consensus with respect to the US economy: the labour market has recovered and rising wage inflation could risk the Fed’s inflation mandate were it not to continue to tighten policy. This may prove to be a dangerous assumption. There are many reasons to believe that the headline US unemployment rate remains a poor guide to wage inflation. In addition, there are numerous additional factors that are restraining wage growth in the US and indeed across many countries in the G10. A comparison to the UK is instructive. The UK labour market recovery has been far stronger and broader than that of the US and yet wage growth is less than half the pre-crisis and long-term trend. Something is afoot in the G10 and is being overlooked by the consensus. Analysing the UK experience shows that many of the factors restraining wage growth are applicable to the US. Were these factors to continue to restrain wage growth, the Fed’s tightening cycle could increasingly resemble to a policy error.
The factors suppressing US wage growth
A comfortable consensus…
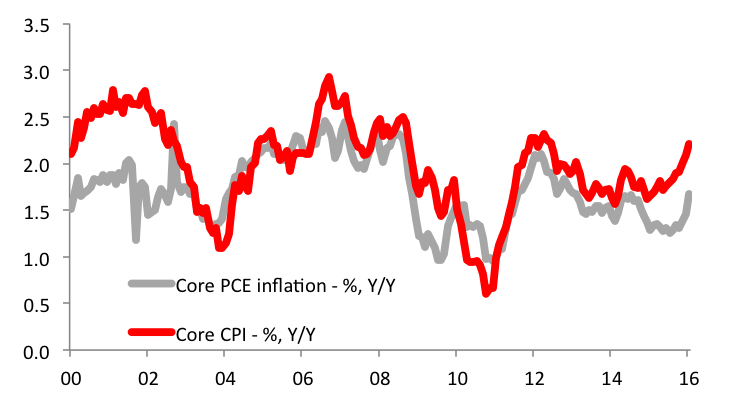
Deflation concerns have eased in the US in recent weeks. The Fed’s target measure of inflation, the core-PCE, rose to a 37 month high 1.69% Y/Y in January and the 3M3M measure returned to 2%. With the labour market appearing strong in February as unemployment remained at 4.9% in February despite a rising participation rate, hopes risen that downward risks to price stability have faded. In this context, the surprisingly weak -0.1% M/M drop in February average hourly earnings was viewed by many as an aberration in an upward trend of wage growth. This picture of the US is a comforting one. It shows a normalising US economy, which justifies the Fed’s steady normalisation of monetary policy.
Chart 1. US core inflation has trended higher in recent months
Source: CEIC
…could prove misplaced
The reality is likely to prove very different from this consensus expectation. The foundations for a pick-up in wage growth sufficient to generate a sustained rise in inflation back towards to Fed’s target level do not appear to be in place. If so, then the Fed’s December rate hike could resemble more Japan’s policy error in 2006 than it could demonstrate prudent policy. At the heart of this more pessimistic outlook on the US economy is the view that changes in the US labour market over the past decade have rendered traditional measures of employment slack – the unemployment rate and initial claims – poor predictors of wage growth. As a consequence, the US economy is still poised to maintain an income-lite phase of economic growth, in a theme which is becoming such a concerning economic (and political) trend in the developed world economy. (Is the US really ready for a rate hike?)
Reasons why the US labour market has room to improve further:
It is worth briefly recapping the reasons why the improving US labour market may have some ways to go before it generates notable and sustained upward wage pressure sufficient to unsettle inflation.
More slack that assumed…
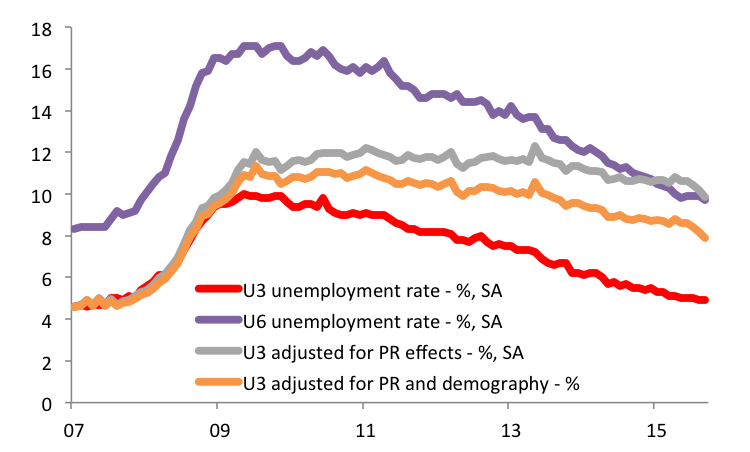
Firstly, there may be more slack in the labour market that is implied by a headline 4.9% unemployment rate. While the labour market participation rate has risen from a low of 62.4% of the working age population in September 2015 to 62.9% in February, this is still far below the 66.0% level pre-crisis (June 2007, the eve of the Bear Sterns mortgage focussed hedge fund blow-up which is an appropriate starting gun for the crisis). This decline in the participation rate alone has removed 7.83mn people from the workforce, more than the current level of official unemployed. It is common to presume that demographic effects drove much of this participation rate decline and the workers that have left the labour market will not return and hence are not exerting downward pressure on wages. However, this is improbable.
Chart 2 shows differing measures of unemployment. The most pessimistic measure simply adds the workers that have left the labour market since June 2007 to the unemployment rate. This overly pessimistic method provides a limiting extreme to demonstrate what the unemployment rate would be with a stable participation rate. This puts unemployment at 9.8%. While, as noted, this is an overly pessimistic assumption, it is interesting that this closely resembles the U6 unemployment rate (9.7%), which takes into account underemployed and discouraged workers. Indeed, the U6 unemployment rate remains around the highs of the early-2000s recession. Finally, the overly pessimistic measure of unemployment can be adjusted for demographic effects. This brings the unemployment rate down to 7.9%, still a considerable distance from the 4.9% headline measure. This analysis suggests that demographics explain only around a third of the decline in the participation rate. This broader perspective suggests that the labour market has residual slack – and also helps explain why wage growth has surprised so many by remaining soft at a time of rapidly falling headline unemployment.
Chart 2. Differing measures of US unemployment: the headline U3 measure understates labour market slack.
Source: CEIC
…and low pricing power of labour
The second reason why US wage growth has surprised on the downside reflects the unusually low pricing power of labour. This in turn reflects a number of factors:
- One unfortunate aspect of an aging society is that older workers tend to have less pricing power.
- Annuity costs. This problem is compounded by the fact that many individuals are choosing to extend their working life. One reason is that low prevailing yields render the cost of an annuity income extremely high. The only cohort which has seen the participation rate increase since June 2007 is among individuals aged 55 and over (from 38.7% to 40.1%.)
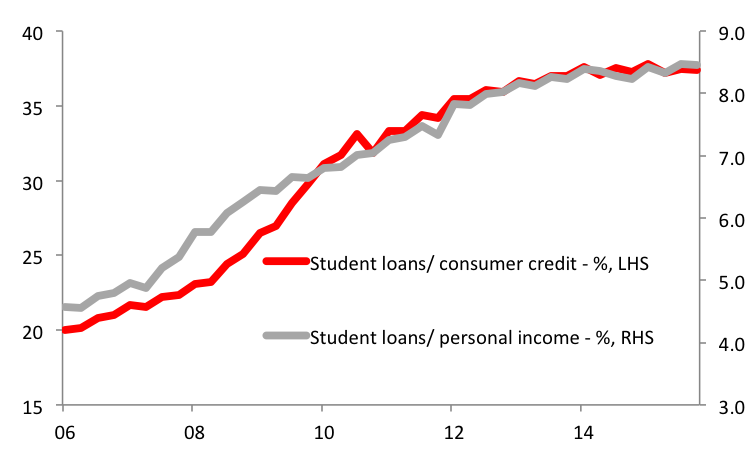
- Student debt. Post the housing bubble, parents are less able to finance children’s education via home equity extraction loans. More of the burden of funding education has fallen on individuals, and the result has been a sharp increase in student debt. Student loans rose from 21.5% of outstanding consumer credit in Q2 2007 to 37.4% at end-2015. Student debt accounted for 76.7% of total US consumer credit growth over this period. High levels of student debt are increasing the need for students to obtain employment and reliable income. (It is also impeding home-ownership).
Chart 3. Student debt has accounted for nearly 77% of the total rise in US consumer credit since mid-2007
Source: CEIC
- Quality of job creation. One feature of the labour market recovery has been how many new jobs have been skewed to lower paying sectors. The proportion of the employment in the 5 lowest paying sectors (leisure and hospitality, education and healthcare, retail trade, transport and warehousing and other services) has increased from 41.7% in June 2007 to 44.8% in February.
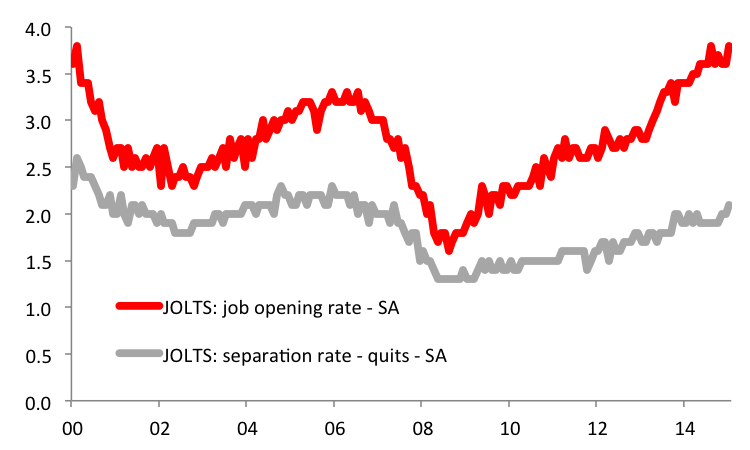
Chart 4. US “job churn” remains laggardly
Source: CEIC
A more cautious US household sector
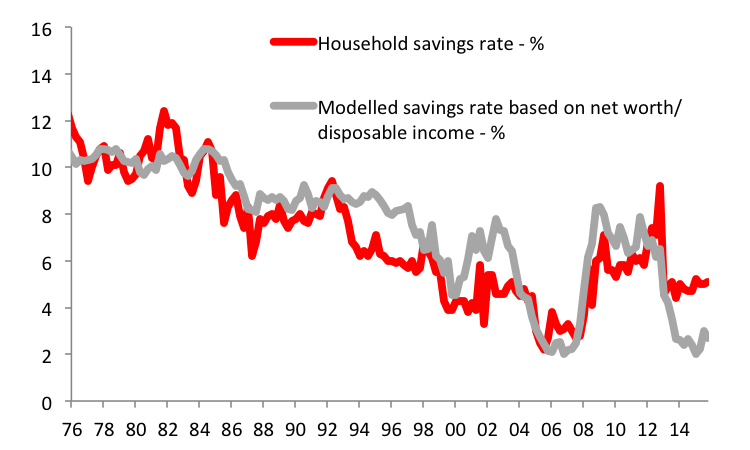
These factors have contributed to reduced pricing power for labour. It also reflects an increased level of risk aversion among US households. These trends are visible in the lack of “churn” in the labour market, where there is a record gap between jobs availability and voluntary resignations from firms. (Chart 4.) It also explains why the household savings rate has risen nearly 2.5pp above the level that would traditional be defined by levels of net worth and income. (Chart 5). Trends have changed in the US household sector and labour market, and weak wage growth is but one manifestation of this shift.
Chart 5. US household savings rates have shifted higher.
Source: CEIC
The UK experience – record employment growth and a halving of wage growth
A broad UK labour market recovery
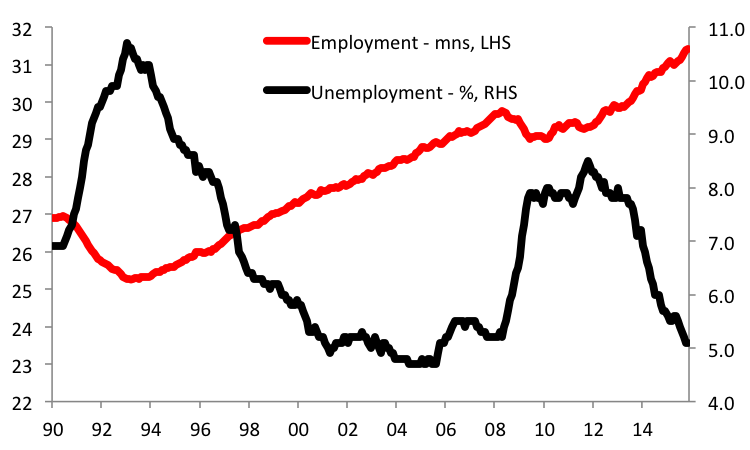
To provide a broader perspective on US wage trends, it may be instructive to examine the experience of the UK, where laggardly wage growth has proven even more surprising to the market. Like the US, the UK has experienced a rapid decline in the headline unemployment rate (to a pre-crisis 5.1%) since the financial crisis. (Chart 6). Unlike the US experience, however, the recovery in the UK labour market has had considerable breadth. While UK unemployment has declined, the labour force participation rate has remained steady at around 63.5%. This has resulted is particularly rapid increase in employment.
Chart 6. The improvement in the UK labour market has been broad.
Source: CEIC
Proportional to the labour market, UK employment growth has been twice that of the US
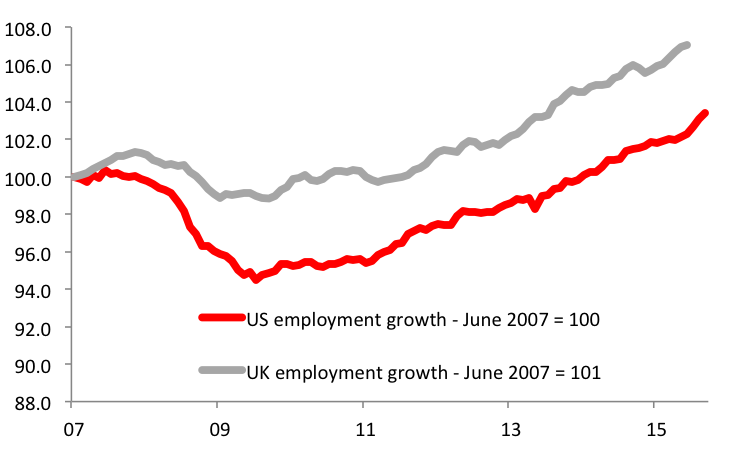
Chart 7 shows the differing levels of employment growth in the US and UK. Since mid-2007, UK employment has risen 2.1mn or 7.0%, while in the US the 4.8mn increase in employment over this period amounts to a far more modest 3.4% increase. As a proportion of the workforce, the UK has been twice as effective as the US in expanding employment.
Chart 7. In relation to the labour force, UK employment growth has been twice that of the US
Source: CEIC
UK wage growth has halved
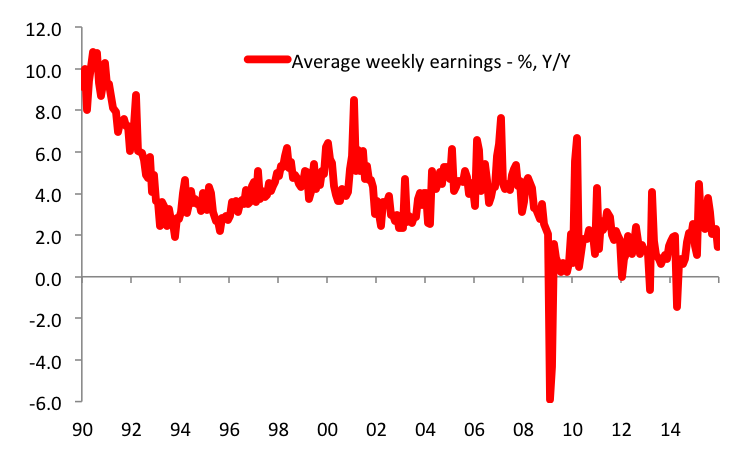
However, despite a record pace of employment growth, UK wage growth has been exceptionally weak. (Chart 8). Since June 2007, average weekly wage growth in the UK has averaged 1.99% (latest reading was 1.43% Y/Y in December 2015). In contrast, for the early part of the 2000s, average wage growth was 4.34% and in the 1990s wage growth averaged 5.1%. There has been a halving of pre-crisis wage growth. This is an important consideration for those expecting a recovery in wages in the US since the UK labour market demonstrates a far less equivocal return to normality – and yet wages are still stagnating. Nor can this trend be blamed on public sector wage restraint amid a government austerity drive: private sector wage growth sine June 2007 has averaged 1.96% compared to 4.26% earlier in the decade.
Chart 8. Post-crisis, UK wage growth has halved, despite an ostensively strong labour market.
Source: CEIC
The producivity explanation
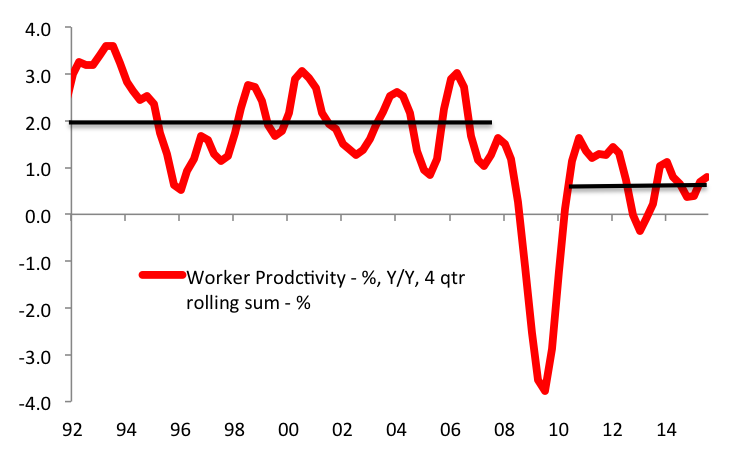
The common explanation for the weakness of UK wage growth has been the low level of worker productivity. Productivity growth since June 2007 has averaged 0.26% Y/Y. If the crisis-related collapse in output is removed, since 2010 worker prodctibvity has averaged 0.85%. By contrast, the trend rate of UK productivity growth is 2.0%: from January 2000 to May 2007 producitvity growth averaged 1.96%; in the 1990s it measured 1.97%; in the 1980s it measured 2.06%. While this notable decline in productivity is a common explanation of low UK wage growth, the explanation is not quite that simple.
Chart 9. UK worker productivity has halved post crisis.
Source: CEIC
Cyclical expanations for low UK producivty appear weak…
Low productivity would clearly drive wages lower if it were caused by “labour hoarding” whereby companies anticipating a pick-up in demand decided to retain surplus workers to avoid having to rehire them. In so doing, the productivity of each worker would naturally decline and companies could more easily lower wages. However, this expanation does not fit the UK where there has been a strong recovery in demand in the past two years and where the recovery in the labour market has been sustained. Few companies can justify continued labour hearding.
…with structural forecs more likely at play
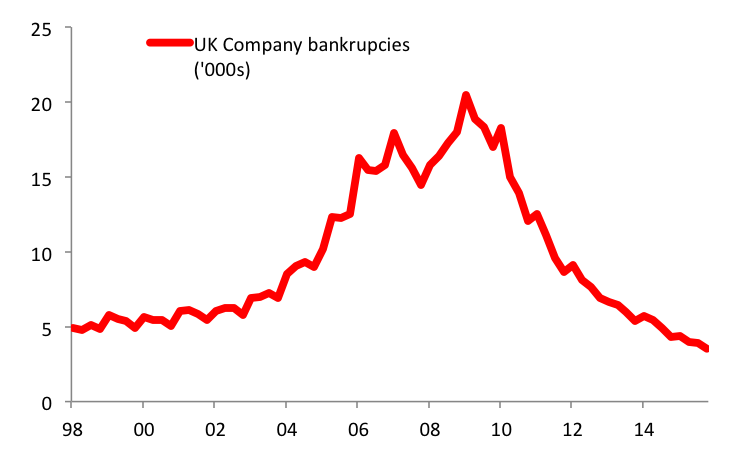
There are two more structural explanations for poor UK worker productivity. The first concerns the interaction of the Bank of England’s pronounced monetary easing and the tightening of financial regualtions caused by Basel III and, increasingly, MiFID II. By lowering interest rates to record lows and unleashing a QE program that amounted to 20% of the UK GDP, the Bank of England – as a policy goal – suppressed to price of credit. Lower borrowing costs, allied by a desire of banks to roll-over loans rather than fully recognise loans has contributed to unusually low levels of corporate bankrupties, particularly among SMEs. In Q4 2015, 3,529 companies in the UK field for bankruptcy. This is the lowest since 1989 and comapres to 16,486 in Q2 2007. To some extent, “zombie company” effect is at play in the UK. Meanwhile, one of the global consequences of the Basel III solvency and liquidity frameworks has been a reduced access of small and medium scale enterprises to fresh bank loans. This has slowed to growth of new SMEs. This is a combination that detracts from productivity growth due to sub-optimal resource alloctaion.
Chart 10. The QE effect? Bankrupcies slide as the price of credit is suppressed.
Source: CEIC
A second structural expalnation is the low level of public and private investemnt in the UK, which was a pre-crisis trend. Improved public infrastruture and improved corporate investment in technology and capital could be ways to increase worker producity.
Productivity is not a sufficient explanation
Even if these structural explanations for low productivity were correct, they would not necessarily comprise a binding constraint to wage growth were labour conditions sufficiently tight. If labour supply was tight and a company needed to increase production it may still be required to employ more workers at a higher wage and accept higher unit labour costs and a lower profit share of revenue. Traditional measures of labour market slack would suggets we are at this point in the UK, and hence there remains a surprise at the persistently low level of wage growth even taking productivity into account. While producitvity is clearly a factor that limits the desire for UK companies to increase wages, other factors appear to still be at play.
Tying the analysis together – the impliations of the UK labour market recovery for US wage growth
The expereince of the UK provides several insights for the US, many of which reinforce the view that wages are going to remain subdued.
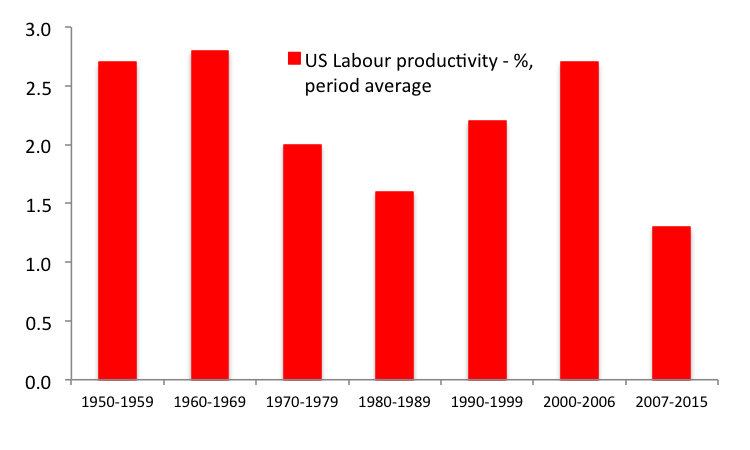
Productivity. Like the UK, US productivity has declined post crisis, just as potential GDP growth and the neutral level of the Fed Funds have both decresed. Since 2007, US worker productivity has averaged just 1.3%, compared to 2.7% from 2000-2006 and 2.2% in the 1990s. It is the weakest period of productivity growth on record, and the trend shows little sign of improvement: since 2010, a period which strips out the peak output volatility caused by the Great Recession, productivity growth has measured just 0.6% and in Q4 2016 productivity declined by saar of 2.2% SAAR. (Chart 11). Low producitvity implies muted wages gains in the US, particularly if the analysis above is correct and more slack remains in the US labour market than is implied by the low headline unemployment rate. The greater slack in the US vs. UK labour market may make productivity a more powerful explanation for weak wage growth in the US than it is in the UK.
Chart 11. US worker productivity growth has also slowed pos-crisis.
Source: CEIC
As an aside, a 3.2% saar pick-up in US Unit Labour Costs in Q4 2015 caused considerable consternation in the market by stoking concens that wages are accelerating. However, the breakdown of this number showed it reflected a modest 1.0% saar rise in worker compensation and more importantly by the aforementioned 2.2% decline in productivity. This is important. If ULCs are rising due to wage gains, then companies may be faced with an erosion of margins as wages take a higher proportion of revenues at the expense of profits, and this has been the common narrative in the market following the Q4 ULC data. However, if laggardly productivity is behind a rise in ULCs a company has more options to preserve margins, such as sheddign labour or curbign wages.
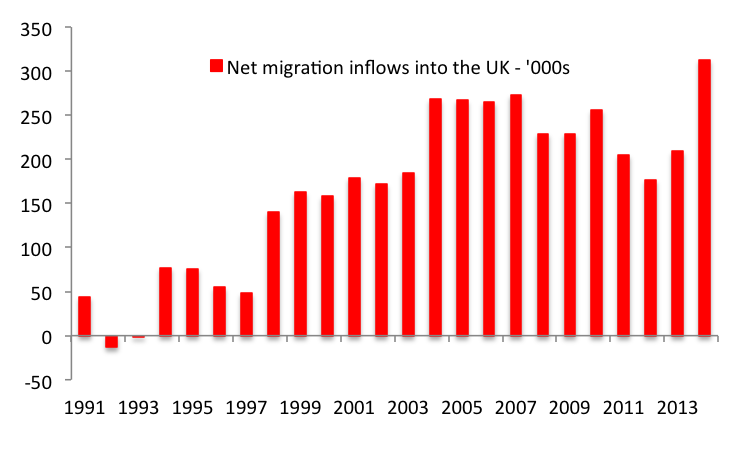
Labour supply. The UK has experienced a supply shock in the labour market, which has helped to both keep the participation rate high and fueled rapid employment growth without stoking wages. Firstly, the UK has experienced a sharp increase in net immigration in recent years (Chart 12), which encompasses individuals at both ends of the skills spectrum. Secondly, the welfare reforms of the conservative government have pushed individuals into the workforce by reducing welfare benefits. The effect of increased supply of workers restainign wage gains may have relevance for the US were the assumption to prove correct that the US labour market is far from full employment. Were a portion of the 7.8mn workers who have left the labour market since June 2007 return – which would be associated with a rising participation rate – the experience of the UK suggests that wage restraint will result. (US wage data may imply that these workers are still exerting downward pressure on wages even while remaining as discouraged workers or beign under-employed).
Chart 12. Net immigration inflows has boosted the UK labour force.
Source: CEIC
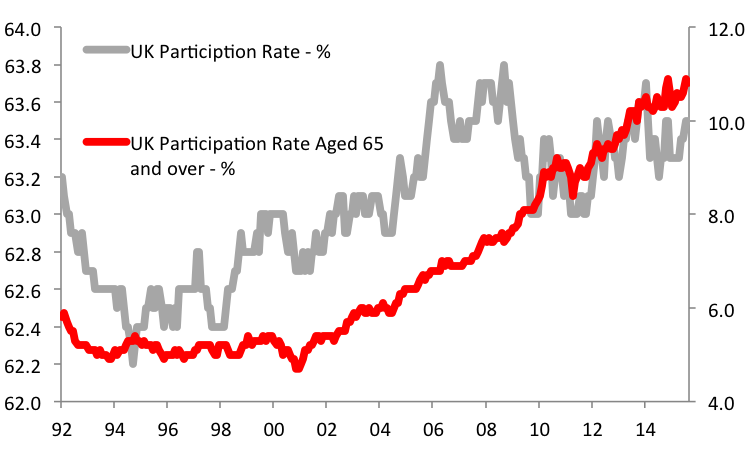
Demographic and annuity income effects. While the UK’s openness to immigration has helped ease the demograhic challenge which faces so many economies, there are nontheless a growing number of indivuals moving into the 50 and above age cohort. In 2014, 23.2% of the population was aged 60 and above, up from 18.8% in 2007, while for those aged 49 and above the share of the population over this period has increased from 38% to 43.3%. This comes at a time when the UK shares the global trend of an increased cost for an annuity income stream. In addition, the age eligibility for a state pension in the UK is increasing. Unsurprisingly, the participation rate of older workers is increasing, particularly for individuals aged 65 and over, having risen from 7% in June 2007 to 10.8% in November 2015. (Chart 13).
Chart 13. The UK participation rate has been stable post-crisis, but has continued to rise for the 65 and older age cohort.
Source: CEIC
Quality of jobs. One trend of the UK labour market recovery has been the disproportional rise in the number of jobs that could be considered poor quality. The key example is the growing use ot Zero Hours Contracts (ZHCs) which do not provide any guarantee of weekly work and hence income. The UK office of National Statistics has recently started tracking this data and latest figures show that in Q4 2015 801,000 individuals were employed on ZHCs which amount to 2.5% of the work-force. A year earlier 697,000 workers were on ZHCs or 2.3% of the labour-force. At end-2015, the ONS said that 37% of workers on ZHCs wished to work for more hours compared to just 10% on more traditioal contracts. ZHCs clearly exert downward pressure on wages for the individuals employed on these terms, but also help limit the pricing power of workers more generally. Again, the quality of employment in the UK echoes a theme of the US labour market recovery.
This trend is also consistent with a steady decline in the influence of trade unions on the labour force in the UK. Latest ONS surveys show that between 1995-2014, the proportion of workers belonign to a trade union declined from 32.4% to 25.0%.
The exception that proves the rule? Areas where the US and UK differ.
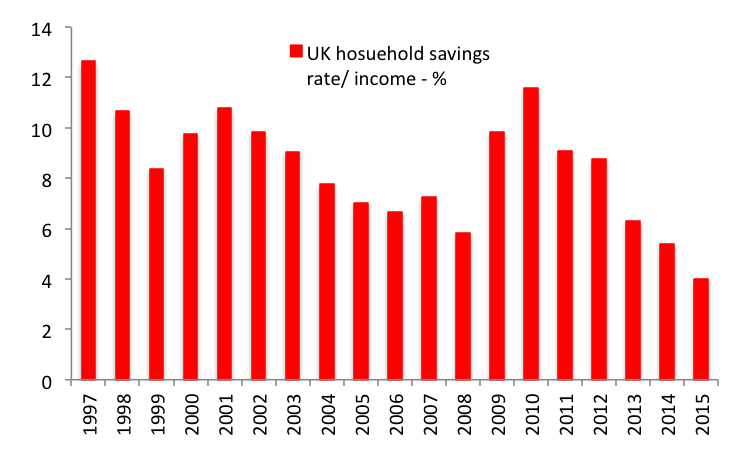
In other areas, however, there are notable difference bewteen the US and UK household sector. In particular, the UK households show fewer signs of caution compared to those in the US. The UK household savings rate, for instance is trending lower at measured 4% in the first 9 months of 2015, already below pre-crisis levels. (Chart 14). In additon, there are greater signs of “job churn” in the UK labour market. Voluntary separtions as a portion of the labour force have risen to a pre-crisis lvel of 0.83% in Q3 2015, up fron the nadir of 0.35% in Q1 2009. These factors make it appear even more anomalous that wages in the UK have not picked up. It suggests the importance of the factors restainign wage growth that have been noted above.
Chart 14. UK hosuehold savings have decliend post crisis, in contrast to the US.
Source: CEIC
Conclusion – expect continued, subdued US wage growth – and a higher probability of a fed policy error
A comparison of the UK and US labour markets, reinforces the view that US wage growth will continue to disappoint. The UK labour market is far ahead of the US in terms of normalising to pre-crisis trends, and yet still shows an absence of notable wage growth. That should be a cautionary tale to those expecting the current US labour market recovery to be increasingly inflationary. This is particularly the case since so many of the factors restraining UK wages during the recovery cycle are applicable to the US: low productivity growth; fresh entrants into the UK labour market/ the potential for a higher participation rate in the US; demographic effects; issues surrounding the quality of jobs. When one additionally takes into account how US households appear more cautious than UK counter-parts (divergent trends in household savings rates, relative levels of job churn) and throw into the mix some specifically US issues that are restraining the bargaining power for wages (most notably, rapidly rising student loans) it becomes harder to be optimistic on the issue of a normalisation of US wage growth.
This suggests that the easing market concerns over disinflationary trends in the US may be mis-placed, and also highlights the potential for a Fed policy error were it to continue to tighten policy on the presumed need to restrain inflationary pressures due to a low headline unemployment rate. This adds yet another risk factor to a world economy already replete with dangers across the G10 and emerging market universe. In this context, it is worth restating that the uncertainties in the world economy and the associated non-linear market risks make it particularly timely and important for investors to embed convex strategies and considerations into their portfolios.