
The US interest rate market is maintaining longer-term path to lower trading ranges in terms of yields. This is under-pinned by a lower “neutral” real Fed Funds rate. It also reflects an underlying weakness in the US economy, which reduces the resilience of the expansion to domestic and external shocks and which also questions the Fed’s presumed exceptionalism – it’s view that it can tighten policy while the rest of the world is looking to ease. Indeed, despite yet another ratcheting lower of it’s presumed path of policy tightening at its June FOMC meeting, the Fed still appears overly optimistic on the path of rate hikes. Once the Brexit-related gyrations in global risk premia have passed, the underlying trend of lower yields in term-US interest rates is expected to continue. Investors will continue to be rewarded for retaining core “received” positions. Meanwhile, one trend which is supporting the declining trend in UST and US IRS yields – falling real yields – is also serving to preclude a source of “illusory” alpha which benefitted the asset management industry pre-crisis, and which is now supporting the rise of lower cost passive investment strategies.
Collapsed real yields and the lack of easy to attain illusory alpha
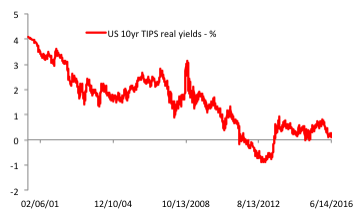
In a world of collapsed real yields, the task of generating notable alpha within investment portfolios – or at least a plausible illusion of such – has become far more challenging. (Chart 1.) To take the US as an example: as 10yr TIPS real yields have declined from over 4% at the start of the 2000s to around 2.75% pre-crisis to around a mere 5bp at present, it’s no wonder that many investment strategies have struggled to generate returns. The decline in real yield has meant a far less forgiving climate for investment strategies that lose principal, since gains are so much harder to come by. This has in turn fuelled the cost pressure confronting active fund managers, and hence has supported the rise of lower-fee passive investment strategies.
Chart 1. US real yields have slumped in recent decades, removing an easy source of “illusory alpha”
Source: Bloomberg.
The early Christmas present – the chance to receive US rates ahead of the Fed’s December hike
Yet, from time to time the market throws up gifts – trades and trends that have overwhelming asymmetric risk-reward characteristics. Much of the focus of our research has been on locating these asymmetries, whether they be trends as diverse as receiving JPY IRS, long gamma positions on the Saudi Arabian FX peg, or finding ways to position for China’s unfolding monetary and FX policy shift. One of our favoured recent asymmetries, however, concerned the US interest rate market on the eve of the first Fed rate hike ( is the US economy really ready for a rate hike? ). Quite simply longer-term US yields were far too high, with the 10yr UST yielding 2.27% and the 30yr bond at 2.99% on the eve of the Fed’s December hike.
Receiving the USD IRS 5fwd 5yr
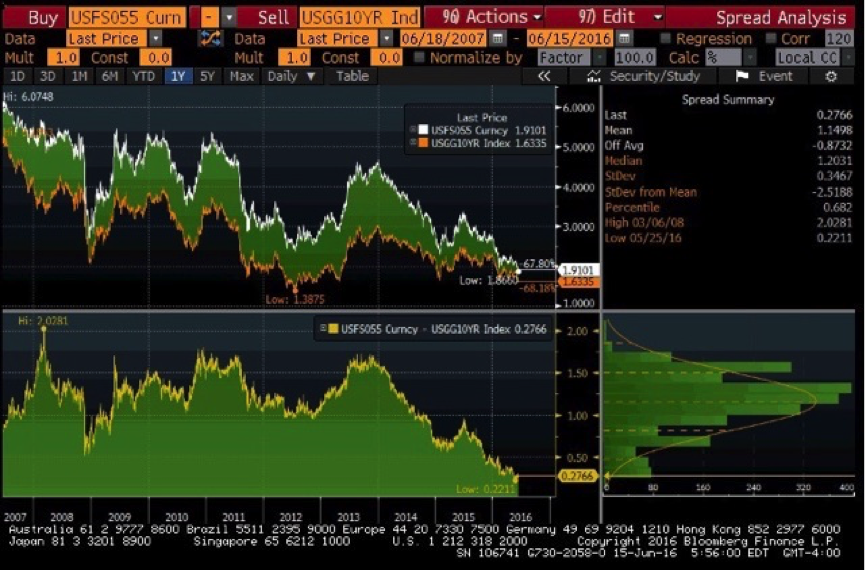
Our favoured way to express a bullish view on US interest rates was to recommend receiving the USD IRS 5fwd 5yr at 2.75%. We view this interest rate as an increasingly important bellwether for the US interest rate market given it’s slope (5s10s) and level (10s) components. We also expect a steady compression of the spread between 10yr USTs and the USD IRS 5fwd 5yr as the term premium declines, and as the market lowers its view of “equilibrium” longer-term Fed Funds rate and reduces its expectation for a back-loaded tightening cycle. (Chart 2.) We looked for the USD IRS to move to a new, lower 2.0% pivot of its trading range. With this new pivot rate having been established, it is worth considering what next for US interest rates?
Chart 2. We expect a continued compression of the spread between the 10yr UST and the USD IRS 5fwd 5yr – %
Source: Bloomberg
The Fed’s presumed exceptionalism
First, a recap of why we have disagreed with the Fed’s presumed exceptionalism – with its willingness to hike when most of the rest of the world is easing. Indeed, the hike and the tendency of the FOMC to seek reasons to be hawkish in 2016 have both been concerning as they represent something of a shift away from the analysis of risk asymmetries which had characterised the Fed’s reaction function since the Lehman collapse and which had served it well. The new approach has also been analytically weak, as evidenced by the continued ratcheting down of the presumed path of Fed rate hikes in recent FOMC meetings. Our reasons for pessimism and why we feel the Fed should not have started a hiking cycle are two-fold.
The domestic factors arguing against a Fed tightening
Firstly, while the US economy is among the healthiest of the major economies, it clearly does not have a clean bill of health. A number of factors are winnowing away at the resilience of the economic expansion (a fuller discussion of which can be seen here and here):
- A more cautious household sector that has seen a structural rise in its savings rate.
- A reduced pricing power for labour.
- Continued labour market slack, whereby demographic effects explain only a third of the 8.6mn individuals that have left the labour market as a consequence of a fall in the participation rate since mid-2007. The headline U3 unemployment rate (4.7% in May, the lowest since November 2007) has lost its veracity as a guide to wage pressure, especially as the 8.6mn departures from the labour market are larger than the 7.4mn registered unemployed as measured by U3.
- Like much of the developed world, US productivity growth has slumped.
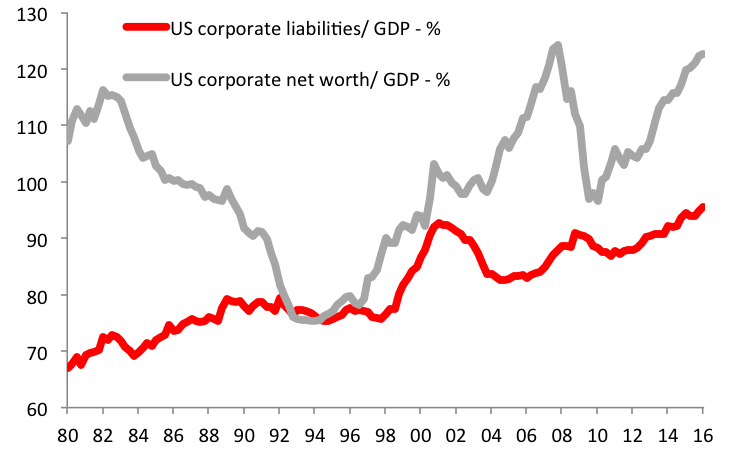
- The corporate sector is highly indebted. In Q1 2016 corporate liabilities rose to a record 95.6% of GDP, surpassing the tech-bubble peak with the largest growth seen in issuance of debt securities (31.1% of GDP in Q1, up from 25.1% in Q1 2009, the nadir of the crisis. (Chart 3.) An increasing portion of debt issuance has been used to finance share buy-backs compared to fresh investment and the debt over-hang is a concern given the current decline in corporate profits. While the optimists would point to how the net worth of corporates has surged (122.6% of GDP, compared to 109.9% in Q1 2009), this comfort is somewhat illusory since it hinges on elevated asset valuations. The record level of corporate net worth was 124.3% of GDP, posted in Q4 2007…
Chart 3: Rising corporate net worth provides limited comfort to the record levels of corporate indebtedness
Source: CEIC
The international factors arguing against a Fed tightening
Secondly, the Fed’s presumed exceptionalism looks even stranger when one considers the myriad downside risks to global growth and the associated march to ever more unorthodox monetary policies in much of the world. The risk factors include the non-linear economic and FX risks associated with China’s structural growth slowdown, the recession and deflation engine of the Eurozone, decelerating global trade growth, Japan’s efforts for Abenomics to gain traction and the risks emerging markets face as over-leveraged corporate and banking sectors are confronted with slow developed market growth. The fight against the a growing deflationary outcome for the world economy looks set to dominate global policy formation over the coming years. (The Income-lite recovery trend). To believe that the US would be immune from these downside risks to global price stability would appear to a folly approaching the common view heading into the financial crisis that emerging markets could “decouple” a recessionary US economy. (Yes, time does not take away the shock that so many people would espouse a decoupling view.)
Underlying inflation risks remain muted
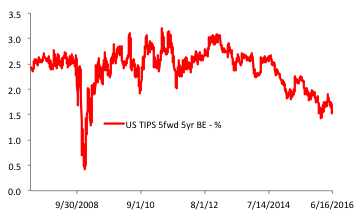
Domestic and external factors suggest that the Fed should not be concerned about inflation. While the Fed might point to an upswing in wage growth and core PCE inflation, we have seen these intra-cycle moves on numerous occasions since 2009 and the conditions for a sustained and inflationary rise in wage growth remain absent. It is worth recapping the inflation concerns prevalent in February when the core PCE rose to a 40 month high 1.74% Y/Y and the 3M/3M rate– which provides a measure of inflation momentum – rose to 2.20%. However, the Y/Y and 3M/3M rate have since declined to 1.60% and 1.64% respectively. As we warned at the time, we have been here before: the 3M/3M rate has briefly moved above the Fed’s 2% target post crisis, only to fall back. It rose to 2.22% in January 2012, 2.57% in May 2011 and 2.38% in October 2009. Meanwhile survey based inflation expectations continue to slide with the University of Michigan’s long-term inflation expectations survey seeing a sharp 0.4pp drop in May to 2.40%, the lowest since September 2009. The market also remains sanguine about inflation with the 10yr TIPS breakeven at 1.50% and the TIPS 5fwd 5yr BE at 1.57%, far below the Fed’s inflation target and not at a level one would presume into a mature economic expansion. (Chart 4.)
Chart 4. The US TIPS market shows little concern over inflation
Source: Bloomberg
The tin-foil hat argument and the use of heavy machinery
Some continue to argue that the Fed needs to hike now in order to provide it room to ease if and when the next downturn happens, just as analysts in Japan called upon the Bank of Japan to hike during the 2000s. This argument betrays an “unorthodox” understanding with respect to macro-economic demand management (“let us undertake policies that will increase the potential of a recession in order to have more ability to ease when said recession occurs”), and one must hope that the more ardent exponents of this view do not operate heavy machinery.
The Fed’s photo-shopped DOT-plot view of reality
The interest rate markets are reflecting economic realities more than they reflect the Fed’s hoped-for outcome, as outlined in its “DOT plot”, which is an idealised representation, heavily photo-shopped, of how the FOMC would hope the economy would be rather than how it is. The June FOMC had to once again slash it’s presumed path of rate hikes as its more idealised view of the world encountered reality, with fully 62.5bp of hiking removed from the median assumption of the Fed Funds rate in 2018. Given these factors it is clear to see why we felt the level of longer-term US interest rates was simply wrong 6 months ago, and the Fed rate hike merely accelerated the adjustment to a new lower yield level.
The Fed’s neutral rate assumption and the choice of a 2% pivot
The choice of the 2% level for our initial target as the pivot of this interest rate reflected our view of the neutral level of interest rates. Across the developed world, and much of the emerging market universe, the level of neutral policy rate has slumped. (The Income-lite recovery trend). This is due to interplay of factors that have differing weights in differing countries:
- The tightening of monetary conditions implicit in Basel III, which has sharply lowered the neutral policy rates (and through extension changed variables such as convexity, term premium, and curve shape across yield curves).
- Demographic induced declines in secular growth.
- The persistent cyclical drop in economic growth implied by the slide in productivity and weak levels of corporate investment. (The persistence of these trends holds out the worrying potential that they become structural).
- A diminished pricing power for labour.
Over the past 5 decades, the “neutral” Fed Funds rate has been around 300bp in real terms. While this has been declining, much Fed analysis believes that that looking through the cycle, the neutral real Fed Funds rate is 175bp, or 3.75% in nominal terms if one assumes that inflation will be at the Fed’s 2% target. A 3.75% neutral Fed Funds rate – seems far too high considering the cycle and – critically – structural changes taking place in the economy. Acknowledging this reality, the latest FOMC DOT plot confirmed a continued downtrend in the Fed’s own long-term estimate of the Fed Funds rate. The June FOMC saw this long-run rate lowered to 3.0% rom 3.25% in March and 3.75% a year ago. Even a 3.0% long-term nominal Fed Funds rate – and 1.0% real Fed Funds rate – appears high, and the risk is that the US yield curve would have inverted long before this point was reached.
Fed acknowledges a current neutral real rate of 0%
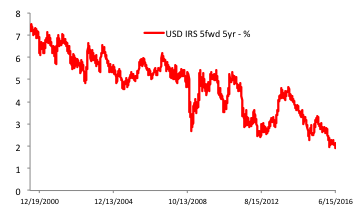
Although focusing on the cyclical rather than structural risks in the US economy, the Fed nonetheless acknowledges that the current neutral rate is far lower at present. To quote Janet Yellen from earlier this year: “Although estimates vary both quantitatively and conceptually, the evidence on balance indicates that the economy’s “neutral” real rate…is likely now close to zero.” With a 2% inflation target, that implies a neutral nominal rate of 2%. Of course, the Fed expects this neutral rate to rise over time, but there is a danger that they are under-stating the structural and cyclical headwinds the economy faces. Plus, even if they are right, for a 10-year interest rate, even in an optimistic scenario there would be a considerable period of time when the rate was sub-2%. We feel very confortable with our view that the USD IRS 5fwd 5yr should pivot around 2%, with movement to 2.15-2.20% seen as opportunities to receive rates once more, with 1.80-1.85% seen as opportunities to take profit.
The shortage of HQLAs, and challenge in funding the “L” component
As an aside, an additional factor supporting lower US interest rates is the growing shortage of High Quality Liquid Assets required for Basel III. Global central bank QE is absorbing a growing share of risk free assets, and – in cases – raising questions as to the actual liquidity of the remaining float. (The gyrations of the JGB market which is forcing some Japanese banks to reconsider their primary dealerships, is a case in point). The march of regulatory regimes such as Basel III and MiFID II continue to fuel demand for USTs, which remains the worlds most liquid market and which best satisfies both the HQ and the L aspect of the HQLA requirement.
Chart 5: The trading range for the USD IRS 5fwd 5yr is expected to continue to trend lower.
Source: Bloomberg
A declining trading range for US interest rates
Given our view on the world economy, however, and the reduced resilience of the US economy to external or internal shocks, we do not believe the 2% pivot will last for long. In a world with downside risks to growth and inflation, we would expect the Fed’s presumed neutral policy rate will decline over time, while downside risks to inflation will persist. In the event of a new global downturn, the USD IRS 5fwd 5yr could push to fresh record lows below 1.0%, and even without this the next pivot point for the interest rate is likely to be 1.75% compared to the current 2.0%, and we are waiting to time this shift lower. Given our view that the Brexit vote will be a victory for the Remain camp, a removal of the referendum related risk premium should see a sell-off in global interest rates, but this could be an opportunity to add to received position. (Gilts, the GBP, Brexit and the grudging longs). Despite the ticker-shock of record low yields, the core strategic trade remains to be long of government bonds and received IRS in most developed economies, including the US.
Pingback: The UK decides Brexit – An uncharted path to Tartarus? | Event Horizon Research