
China’s investment-driven growth model is unsustainable in a post-crisis world of low global growth. Weak external demand magnifies the adverse side effects of this growth path – inefficient use of capital, excess industrial capacity, deflationary pressures, high corporate leverage. When these problems are allied to demographic challenges, China appears to be one of the world’s leading economies for which the secular stagnation argument could most readily apply. China’s slowdown is a challenge for the world economy given that China has accounted for nearly a third of global GDP growth since 2007. The challenge for China’s policy-makers is to address the non-linear risks implicit in a highly leveraged and deflationary economy shifting to a lower growth path. Monetary policy will need to remain exceptionally loose. Given this backdrop, there are growing downside risks to the CNY. Already Chinese institutions are increasing their holdings of overseas assets and the scale of China’s domestic liquidity is such that only a marginal increase in demand for foreign assets can swamp the balance of payments: China’s M2 approximates the combined M2 of the US, Germany and Japan. The CNY forward curve would appear to under-price the likely depreciation of the CNY over the next 12 months.
China’s post-2000 investment and credit driven growth model is no longer sustainable
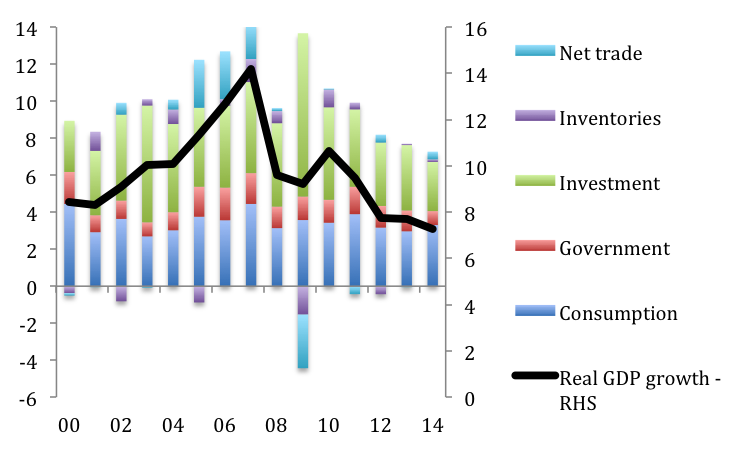
Since 2000 investment has accounted for 47% of China’s GDP growth
China’s post-1978 economic development is a remarkable success story, but since 2000 growth has been increasingly investment driven. Since the early 2000s, China’s policy-makers have responding to weak external or domestic demand by providing the nitrous oxide boost of unleashing corporate investment activity funded by rapid credit growth. Periods of strong growth have seen the government try and slowly rein-in the credit/ investment boom, but the task has been complicated by how dependent the economy has become on investment. Since 2000, China’s real GDP has more than trebled, and growth in fixed investment accounted for fully 47% of this expansion. (Chart 1.)
Few historic antecedents
The global economy has few precedents of such a sustained surge in industrial capacity. In fact, China itself provides one of the few comparable trends, and the comparison highlights the scale of the post-2000 investment boom. The 11.7pp increase in Chinese investment/ GDP since 2000 approaches the 14.4pp increase seen in 1957-1960, the peak years of the Great Leap Forward when a frenetic post-revolution surge for industrialisation saw the country mobilised into capital expenditure, that saw ploughs melted in backyard steel smelters.
Chart 1. Chinese real GDP growth and the percentage point sectoral contribution
Source: CEIC
The inherent drawbacks in China’s growth model
China’s investment driven growth surge has clear drawbacks, which have been understood by the authorities, who have spent the past decade trying to find new growth poles and to support private consumption.
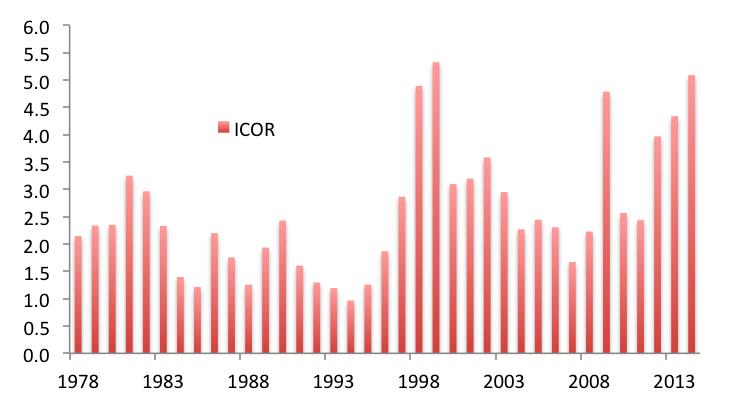
Inefficiency and surplus capacity. China’s corporate investment surge since 2000 can in part be viewed as a quasi fiscal expansion, with the public liability accruing via contingent liabilities in the banking system and net debt at state owned enterprises rather than government bond issuance. External and domestic consumer demand was unable to absorb output created by the expansion of industrial capacity resulting in high levels of surplus capacity and an increasingly low multiplier effect from investment. This can be seen from China’s Incremental capital Output ratio (ICOR), which is a measure of how many units of investment are required to generate one unit of growth. (Chart 2.) This has been trending higher since 2000, surging during periods when investment was used to offset weak global demand, which reflects the low multiplier effect of this spending. In 2014, China’s ICOR ratio surged to 5.1. By comparison, Brazil – a country facing it’s own growth and efficiency problems and which recently lost it’s investment grade rating – saw an ICOR of 3.3. While China’s growth surge since 2000 has been sufficient to account for 32.2% of global GDP growth since 2007, it has involved the least efficient use of investment capital among the world’s large economies.
Chart 2. China’s Incremental capital output ratio highlights an inefficient allocation of capital
Source: CEIC
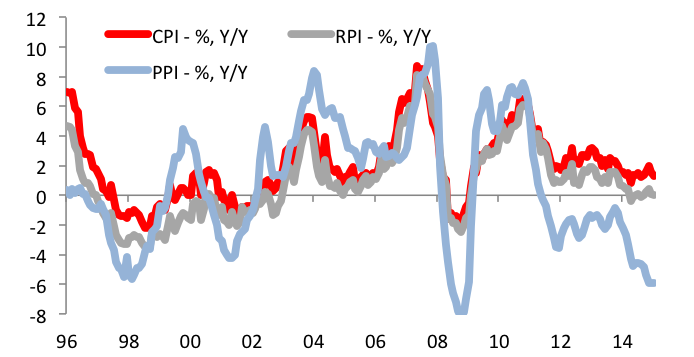
Deflation. A natural consequence of excess industrial capacity is downward pressure on industrial goods prices. This pressure is most evident in China’s PPI, a measure of prices at the factory gate, which declined -5.9% Y/Y in October and has been deflating since February 2012. A broader measure of goods price inflation at the retail level – the RPI – was unchanged at 0.0% Y/Y in October, and has been below 1% for over a year. The headline CPI is displaying more price stability – 1.3% Y/Y in October – which reflects how this measure includes service prices, which tend to be more sticky downwards, and how China’s service sector is relatively protected from international competition. Even then, the CPI continues to surprise on the downside. All these measures of inflation have been trending lower in recent years, in a trend that preceded the swoon in commodity prices. (Chart 3.) More broadly, Chinese nominal GDP growth has started to fall below real GDP growth. Excess capacity has reduced corporate pricing power and helped offset the inflationary impact of impact of higher wage growth., implying a squeeze of corporate margins.
Chart 3. China faces deflationary pressures
Source: CEIC
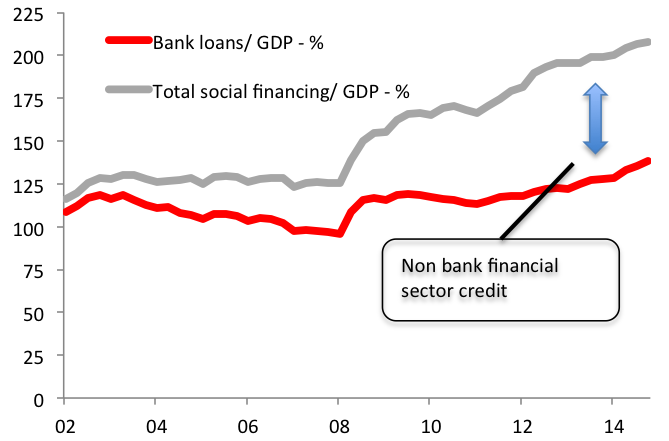
Leverage. Deflation is a particular macro-economic concern in an economy where debt levels are high, and given China’s investment driven growth model a surge in leverage has been a natural consequence of the country’s recent growth path. Since end-2007 (before the financial crisis), bank loans/ GDP have risen from 97.6% to 138.2% in Q3 2015. The rise is leverage is even faster than these numbers imply given the rapid increase in the lightly regulated, non-bank financial sector. Non-bank credit rose from 25.6% to 69.8% of GDP over this period. The combined measure of credit – Total Social Financing – surged from 123.2% of GDP at end-2007 to 208.1%. (Chart 4.) The interest rate sensitivity of the economy has naturally grown substantially.
Chart 4. Post 2000, China’s economy has rapidly increased leverage
Source: CEIC
Pre-2008, strong global demand helped sustain China’s growth model
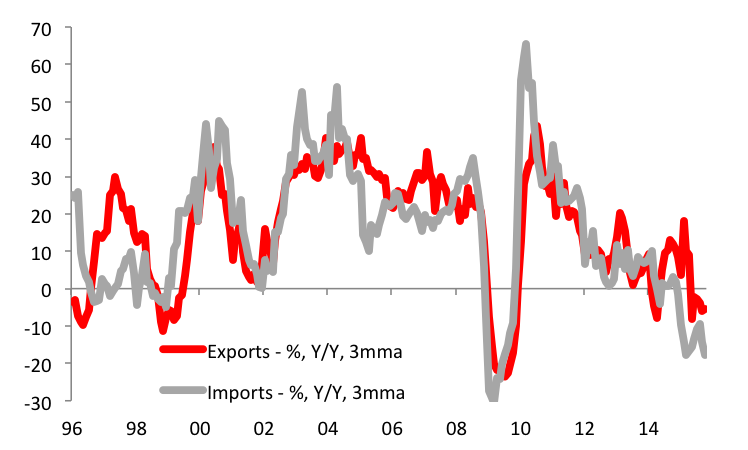
The drawbacks in China’s growth model were evident since the early 2000s and were a concern for the government, but problems were eased by the strength of the pre-crisis global economy. Export growth of around 30% Y/Y from 2002-2007 provided a source of growth that allowed the government to slow the investment surge. The subsequent decline in global demand has restrained Chinese export growth, with October seeing a -6.9% Y/Y decline. (Chart 5.) Industrial production has naturally slowed, and the pre-crisis era of 10+% annual growth look increasingly distant. (October saw industrial production grow 5.6% Y/Y.)
Chart 5. Export growth continues to decelerate
Source: CEIC
Consumer demand has held up better than exports and industrial production, but has failed to take-up the slack, as the marginal propensity to save remains high in China. Factors that are helping to keep the savings rates high include the impact of demographics and an increasing dependency ratio, allied to the absence of a nationwide social security system. Retail sales rose 11% In October, but continues to trend lower having growth by 13.3% 12 months earlier. Naturally, GDP growth is sliding and has fallen below the 7% level that has traditionally served at the authority’s line in the sand with respect to the minimum acceptable rate of economic expansion.
China and the threat of secular stagnation and non-linearity
Secular stagnation is an overly used term…
It is worth considering China’s current growth challenge in light of the concept of secular stagnation. This term is gaining increasingly usage to describe major world economies that are experiencing slower growth. In many cases, the use of this term is inappropriate. Structural explanations for slower growth are often being used to label a deceleration that has much to do with inappropriate macro economic policy settings (overly tight monetary and/ or fiscal policy). As such, the idea of secular stagnation can be a dangerous concept as it can fuel the belief that a country’s growth outcome is increasingly exogenous and that policy-maker are right to lower their ambitions with respect to growth.
…but may apply in China’s case
That being said, China is the world’s largest economy for which the concept of secular stagnation – as defined by a structural and lasting deceleration in actual and potential economic growth – most applies. The investment-driven growth model is no longer sustainable, and the authorities are unable to increase private consumption to the level necessary offset the impact of slower investment. In addition to this challenge, policymakers face demographic forces that will increasingly slow growth. Last year China’s population grew just 0.52%, and the country is set to experience an accelerated rise in the proportion of the population aged 65 and above. This year, the World Bank estimates this cohort to comprise 9.6% of China’s population: in 10 years time the percentage is expected to increase to 14.2%; in 20 years to 21.3%; by 2050 the World Bank estimates the number at 27.6%.
The non-liner risks associated with a highly leveraged economy that slows
Considerable asymmetric risks surround China. An economy slowing from a starting point of such high levels of leverage and where deflation risks abound is a profound challenge if overall levels of credit risk are to be contained. There is the risk of an outcome that is feared by all policy-makers – a dual equilibrium. In China’s case the concern would be that as growth slows below 7%, the levels of leverage in the system become unsustainable and growth slows far further amid rising levels of bankruptcies and reduced domestic demand. China’s financial sector would also be at risk given the amount of leverage that has been provided. While the large banks would be able to withstand elevated levels of credit risk due to their abundant liquidity (and a shortage of alternative investment outlets for depositors to transfer their funds to), far greater risks surround the non-bank financial sector.
China’s policy options to smooth the deceleration
The one child policy and fiscal policy options
From a long-term policy perspective, the authorities have started to address this problem by relaxing the one-child policy. That will have an increasingly positive impact on the economy. However, more immediate policy challenges remain, as the authorities need to ensure a controlled deceleration of growth. While fiscal policy is often an easier way of injecting demand into a slowing economy, in China this policy may have less impact. After all, much of the investment surge can be considered quasi-fiscal expansion. Investing in fresh infrastructure projects could even exacerbate the surplus capacity problem. In addition, local governments have already been aggressive investors, raising funds via Local Government Financing Vehicles, which helped fuel the surge in non-bank credit growth (and the residential and commercial real estate construction bubble). A more effective use of fiscal resources could be investing in a nationwide social security safety net, which could help lower the marginal propensity of households to save, albeit with a slower payback in terms of growth.
Monetary policy needs to stay loose
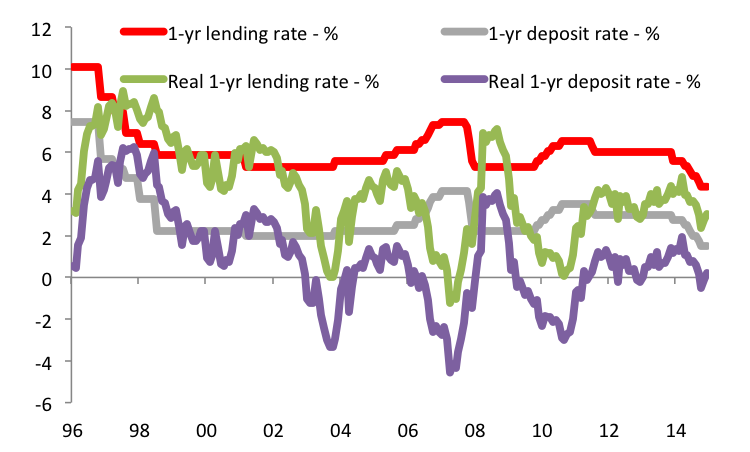
In managing the economy’s deceleration, a considerable burden will be placed on monetary policy. Interest rates need to be low to help limit the further increase in leverage as growth slows. The People’s Bank of China (PBoC) is already engaged on this policy path, last month lowering the key bank lending and deposit rates by 25bp to 4.35% and 1.50% respectively. (Chart 6.) Since last October, these interest rates have declined by 265bp and 150bp respectively. Using the CPI as a deflator, the deposit rate is now 0.2%, having moved from negative territory in recent months as CPI disinflation has outpaced rate cuts. Moving real deposit rates to negative territory would be is consistent with efforts to boost consumer demand. The real 1-yr lending rate, however, remains high at 3.05%. PBoC’s rate cut cycle appears far from it’s terminal point, particularly given Chinas prevailing CPI disinflation which is pushing real yields higher. For China’s manufacturing firms the need for lower interest rates are even clearer since they face the brunt of deflationary pressure, and using the RPI (goods prices) as the deflator show the real lending rate at 4.35%.
Chart 6. Chinese nominal and real benchmark interest rates
Source: CEIC
The implications of China’s slowdown on the CNY
The end of the strong-CNY policy
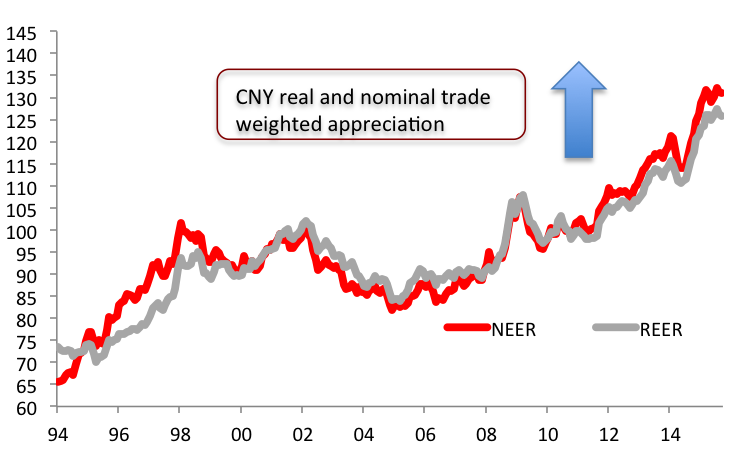
A combination of slowing growth, weak exports, deflationary pressures, rising levels of corporate credit risks and a loosening monetary policy, is not a conducive backdrop for China maintaining a strong currency policy. In this context, the PBoC’s surprise change to it’s CNY FX regime in August 2015 – which saw the currency move to a more managed float and which encompassed some step-depreciations of the CNY – is readily understandable. After all, the formerly close link to the USD had seen a pronounced real and nominal appreciation of the trade weighted CNY during the post-crisis period of a strong-USD. Over the past 12 months the CNY TWI has appreciated 9% and since the end of 2007 by 44.6%. (Chart 7.)
Chart 7. Macro-risks mean that China’s economy is ill suited to the recent trend of sustained currency appreciation
Source: CEIC
Targeting a more stable TWI
This appreciation was increasingly inappropriate given China’s prevailing macro-economic challenges. The new FX regime is more flexible in determining the level of USD/CNY and is – at present – more focussed on keeping the CNY TWI stable. In a climate where the USD is expected to remain strong, a stable TWI alone implies further upward movement USD/CNY. This trend alone is unlikely to be sufficient to imperil some of the broader objectives that had previously underpinned PBoC’s strong CNY policy. An appreciating CNY helped to ensure access to foreign markets by easing trade frictions, particularly with the US given the periodic dance around the question of whether China was a currency manipulator. Additionally, a strong-CNY – coupled with increasing liberalisation of China’s balance of payments – played a role in Beijing’s efforts to internationalise the CNY and secure it’s position as a component of the IMF’s SDR. A policy of a more stable CNY TWI is unlikely to be sufficient to derail these trends, even in a climate of a rising USD/CNY. These considerations still focus the attention of Beijing. Hence despite the slowing economy we are not yet at the point where the authorities would pursue a structurally weaker CNY TWI, although given the asymmetric risks associated with Chinese growth a further FX policy shift in this direction cannot be dismissed over the medium-term.
The asymmetric downside risk to the CNY
Fuel for outflows – China’s USD21.4trn M2: nearly a third of world GDP and close to the combined M2 of the US, Japan and Germany
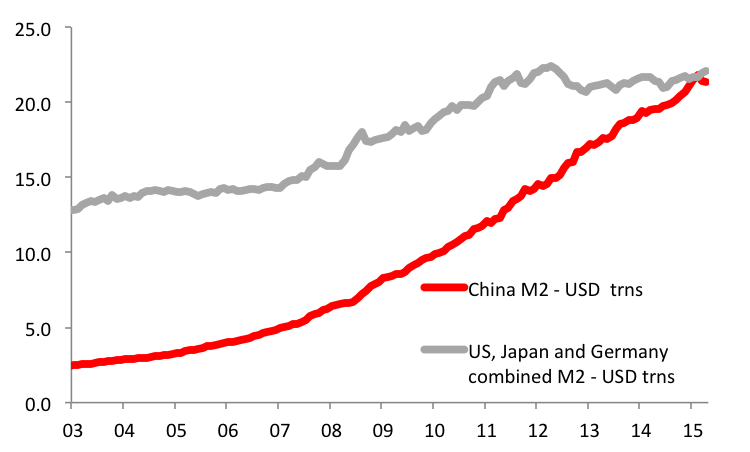
One obvious question is whether the scenario of a stable TWI is too optimistic? Is there a risk of PBoC experiencing a significant CNY depreciation irrespective of it’s policy bias? There are reasons to be concerned in this respect. Most obviously, years of credit-fuelled investment growth have left China’s economy awash with liquidity. It would only take a marginal change in the propensity for institutions and individuals to hold USDs – a process with balance of payments liberalisation has simplified, while illegal capital flows has been a perennial problem for China’s authorities – to swamp China’s balance of payments flows. China’s M2 measured 204% of GDP in September, and at USD21.4trn is only 3.2% (or USD720bn) smaller than the combined M2 of the US, Japan and Germany. To give a sense of the pace and scale of China’s liquidity growth, at the end of 2007 China’s M2 was “just” 63.5% of (or USD9.52trn smaller than) the combined M2 of the US, Germany and Japan. China’s M2 currently measures 29.0% of world GDP, up from 9.5% at recently as end-2007. (Chart 8.)
Chart 8. China’s liquidity growth
Source: CEIC
China is “Underweight” foreign assets
While China has the world’s largest pool of domestic liquidity, the potential for a structural rise in demand for foreign assets is also increased by the fact that Chinese financial institutions are over-weight CNY assets. This reflects China’s history of capital controls. The pent-up demand for foreign assets in likely to be increased over the medium-term by the end of the strong-CNY, while lower domestic interest rate and the bursting of the Chinese equity bubble will both encourage institutions and individuals to diversify their asset holdings.
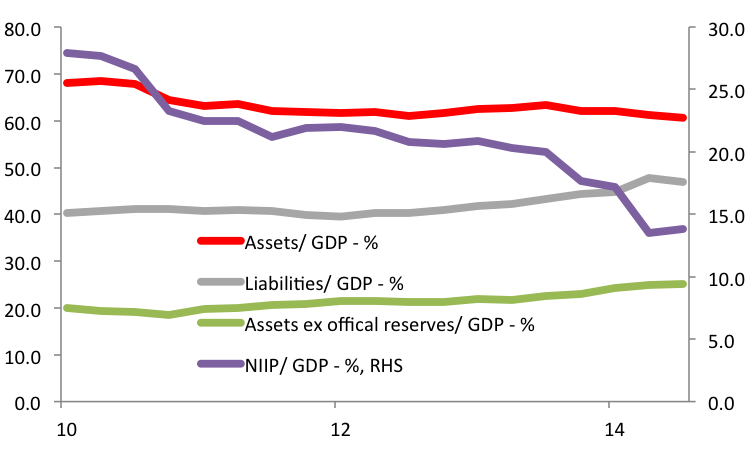
The trend towards increasing exposure to overseas markets is already evident. China’s Net International Investment Position (NIIP, a broad measure of a country’s external assets vs. it’s liabilities) shows that excluding official FX reserves, Chinese foreign assets measured USD2.67trn or 25.1% of GDP in Q2 2015 (latest data), up from USD1.20trn or 19.9% of GDP at end-2010 (the earliest data point in this series). To highlight the underweight nature of Chinese overseas asset exposure, the 2.54% of GDP that China holds in overseas portfolio investments compares to 32.5% of GDP in Japan. In broader terms, overall portfolio asset holdings amount to just 1.3% of China’s M2 while in Japan the comparable figure is 44.9% in Japan. The uptrend in Chinese overseas asset purchases looks set to continue.
The risk of capital reflux
Another danger, and one harder for the authorities to regulate, is the potential for a reversal of part of the multi-year inflow of foreign investment into China. The NIIP data shows that since end-2010 to Q2 2015, China’s foreign liabilities (foreign investment into China) rose USD2.54trn to USD4.97trn. Half of this increase was due to increased portfolio investment into China’s debt and equity markets (USD667bn increase to USD900bn) and via the extension of loans and credit (USD593bn increase to USD1.23tn). (Chart 9.)
There are early indications that foreign exposure to China is starting to unwind. China’s portfolio liabilities (foreign investments into Chinese markets) surged to a peak of USD968trn in Q1 2015 – the height of the domestic equity bubble – or 9.3% of GDP, up from USD387bn (4.0% of GDP) at end-2013. However, Q2 data shows that these liabilities have already started to decline, dropping USD68bn (to 8.5% of GDP).
Chart 9. China’s Net international Investment Position – % of GDP
Source: CEIC
Declining FX reserves…
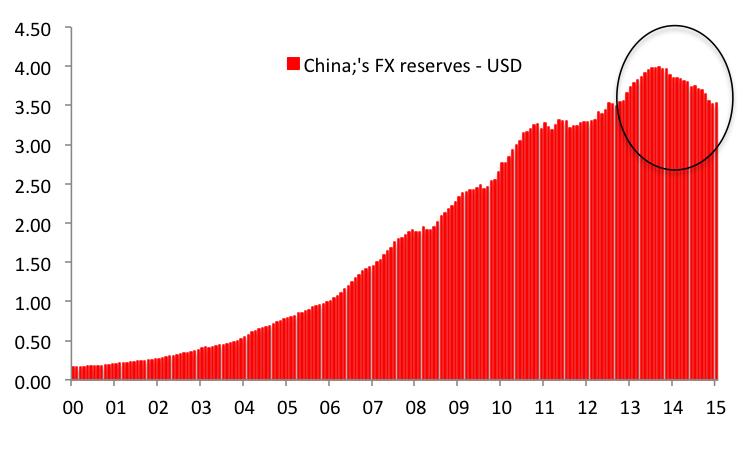
In the face of increased capital outflows, China’s authorities have been steadily shedding FX reserves in order to stem currency weakness. Since reaching a record high USD3.99trn in June 2014, China’s FX reserves have declined 11.7% or USD468bn. (Chart 10.)
Chart 10. China’s FX reserves
Source: CEIC
…and the dilemma of domestic liquidity management
Persistent capital outflows could see a rapid decline in FX reserves, particularly if the need to keep domestic interest rates low meant that PBoC chose to sterilise the liquidity impact of it’s FX interventions. This was the path taken by PBoC following its surprise current depreciation in August. While capital outflows accelerated in August following the FX policy shift, aggressive liquidity injections limited the increase in the key money market rate in the fortnight after the 11th August policy shift – the 7 day repo – from 2.30% to a high of 2.59%, and subsequently guided the rate back to around 2.30%. However, sterilised FX intervention clearly has reduced effectiveness, and the key factor that helped stabilise capital outflows was the market pricing-out of near-term Fed rate hikes, which helped calm emerging markets and global risk assets.
USD/CNY forward curve under-pricing the upward risks to the spot rate
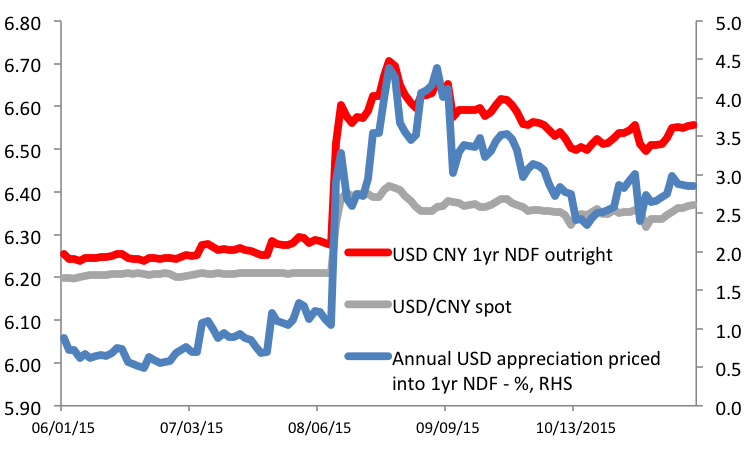
China’s macroeconomic risks and the need for a low nominal and real interest rate climate, reinforces why the strong-CNY policy is unlikely to return. A policy of a stable-TWI in a climate if a strong USD alone would argue that the current 2.9% USD appreciated priced into the 1-yr NDF or the 2.3% priced into the offshore, deliverable CNH 1-yr forward seems to low. (Chart 11.) When one adds the non-linear risks associated with a slowing economy and the potential for a sizable increase in on-shore USD-demand/ capital reflux, not to mention the risk to emerging market economic growth and exchange rate stability that a possible Fed tightening might provoke, a long-USD/CNY position appears to provide an attractive asymmetric risk profile.
Chart 11. Is the market under-pricing the upside risk to USD/CNY?
Source: CEIC
Liquidity not policy rate considerations dominate the CNY IRS curve
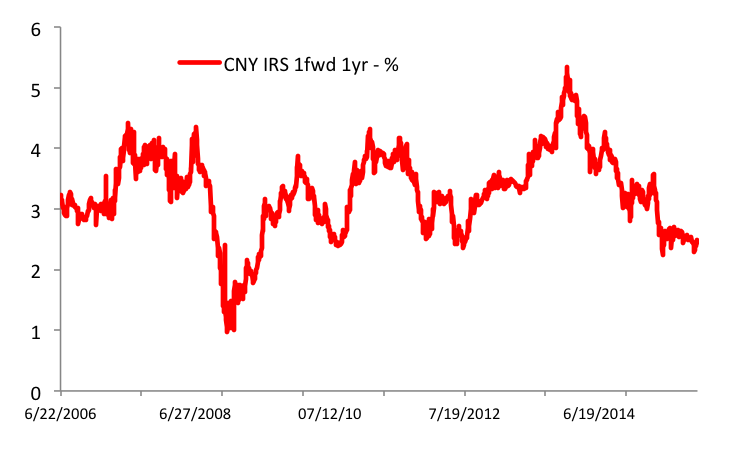
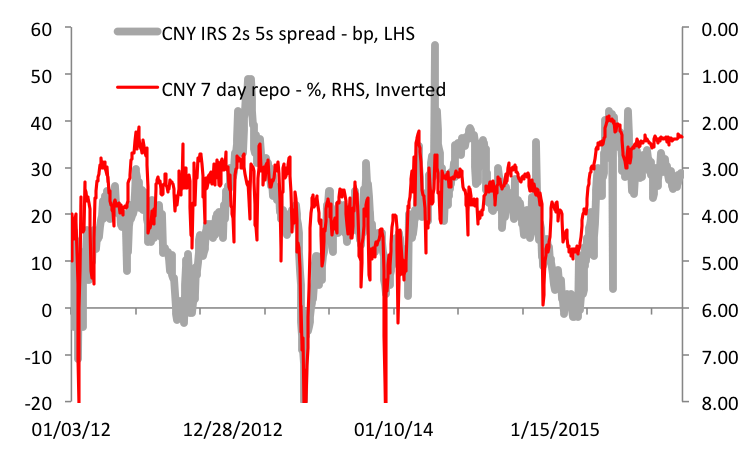
While a belief in further interest rate cuts should support confidence in continued declines in CNY IRS yields, things are not that simple. (Chart 12.) The CNY IRS curve has little to do with anticipated policy rates and is instead a liquidity curve, driven by the fixing rate (7 day repo) which is in turn largely driven by the liquidity conditions at China’s four policy banks. While PBoC is indeed likely to keep liquidity ample and from a strategic perspective and received positions in the liquid 2-5 year part of the CNY IRS curve look appealing, there is the risk of a notable counter-trend increase in yields that urged caution.
Chart 12. Front-end CNY IRS yields are vulnerable to unsterilised FX intervention
Source: CEIC
The risk surrounds the CNY. The weak global growth outlook allied to the Fed’s more hawkish recent tone risk a renewed period of weakness in emerging market currencies/ increased capital outflows from China. It is unlikely in the first instance for PBoC to simply accept notable CNY depreciation and would instead shed FX reserves trying to smooth the flow. The risk to the IRS market would be if PBoC tried to increase the effectiveness of FX intervention and slow the pace of FX reserve accumulation by sterilising less of the liquidity it withdraws from the system. This would see the 7-day repo move sharply higher, and the CNY IRS curve to exhibit a bearish flattening. (Had PBoC not sterilised it’s interventions in August then the CNY IRS 2s5s could easily have flattened to below 10bp rather than remaining broadly static at around 30bp in since 11th August, while the high beta CNY IRS 1fwd 1yr could have seen a 100bp increase in yields. (Chart 13.) Of course, China’s interest rate sensitivity suggests that this is not a sustainable situation and that ultimately the CNY would be allowed to depreciate. Liquidity tightness could be an opportunity to receive interest rates. However, a CNY IRS 2s5s flattener might be an interesting position for investors who expect the PBoC to initially try to resist CNY depreciation.
Chart 13. China’s IRS curve is driven by liquidity, not policy rate expectations
Source: CEIC